
The next stage of the Cannonball project is to build track editing tools. This will take the form of an independent track editor (a cross platform GUI based desktop program), that works in conjunction with the Cannonball engine (to provide the rendering). The editor will output level data for both Cannonball and the original arcade machine. This work is likely to take a good few months, but should be pretty exciting.
In terms of the level data, much of its format is fully understood: sprite/object placement, changing the road width and height, road colour setup and even changing the road texture.
Where I need assistance is with the road path or direction. Whilst I can interpret Outrun's road data into an x position or (obviously) a screen co-ordinate for Cannonball, I do not fully understand how to reverse the Maths used. I need the formula that will enable a user to plot a road path in a level editor, and then convert back to the original format stored in the program code.
Unfortunately, my Maths skills are limited but I'm hopeful there's someone out there who can look at this and outline how we can produce the path format stored in rom. Maybe it's trivial. Maybe I should have taken Maths class past the age of 16. ;)
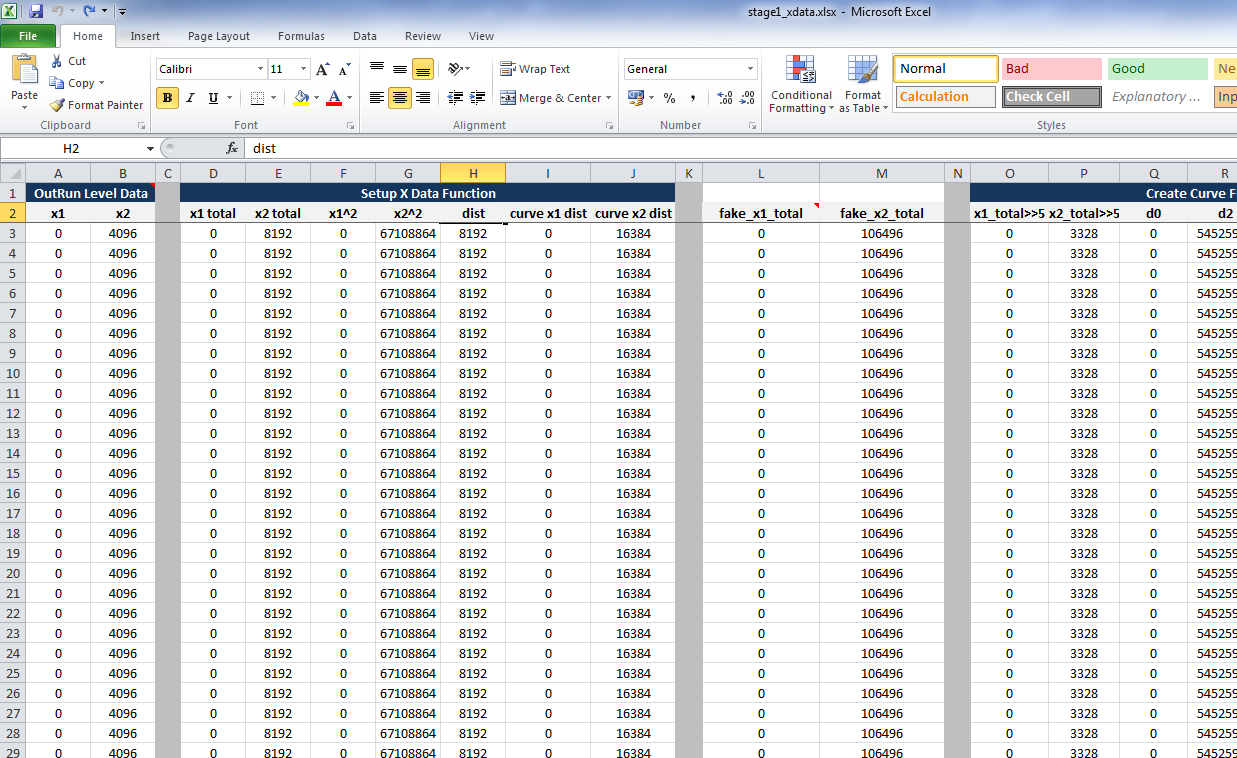
To simplify the problem, I've created an Excel spreadsheet. The spreadsheet uses as input the raw level data stored in the program code (Columns A & B). It runs it through a series of calculations (tab 1), similar to the program code, and outputs the path of the road as a line graph (tab 2).
 Excel: More fun when rendering OutRun tracks.
 Coconut Beach Track Path. Note the chicane at the end.
As mentioned, the level data does not contain width, height, objects or anything else. Nor should we care about that. It's simply the road path.
The input columns are A & B. I'm pretty sure A relates to the road direction, and B somehow relates to the length of the direction. But I might be completely wrong.
On the third tab of the spreadsheet, is the C++ code that handles this data, which you can also refer to if you're a coder.
You can download the Excel spreadsheet here. I've also uploaded it to Google Docs here, but the formatting isn't as good. So work with the original if you can.
Update: This problem has now been solved.
In terms of the level data, much of its format is fully understood: sprite/object placement, changing the road width and height, road colour setup and even changing the road texture.
Where I need assistance is with the road path or direction. Whilst I can interpret Outrun's road data into an x position or (obviously) a screen co-ordinate for Cannonball, I do not fully understand how to reverse the Maths used. I need the formula that will enable a user to plot a road path in a level editor, and then convert back to the original format stored in the program code.
Unfortunately, my Maths skills are limited but I'm hopeful there's someone out there who can look at this and outline how we can produce the path format stored in rom. Maybe it's trivial. Maybe I should have taken Maths class past the age of 16. ;)
To simplify the problem, I've created an Excel spreadsheet. The spreadsheet uses as input the raw level data stored in the program code (Columns A & B). It runs it through a series of calculations (tab 1), similar to the program code, and outputs the path of the road as a line graph (tab 2).
Below you can see we've output the path for Stage 1, Coconut Beach. It's rough because the spreadsheet makes some simplifications with rendering, due to its top down 2D approach rather than the pseudo-3D approach of the original game.

The input columns are A & B. I'm pretty sure A relates to the road direction, and B somehow relates to the length of the direction. But I might be completely wrong.
On the third tab of the spreadsheet, is the C++ code that handles this data, which you can also refer to if you're a coder.
You can download the Excel spreadsheet here. I've also uploaded it to Google Docs here, but the formatting isn't as good. So work with the original if you can.
Update: This problem has now been solved.
12 comments:
I've loved following your development and have learned a lot. If I'm able to help in even the slightest, that would be great. If I'm way off or send you down a blind alley, I apologize up front!
I haven't dug into your source code, but based on your comment that this might be length and direction, it sounds like polar coordinates or something like it.
Perhaps the data structure is a list of vectors encoded as length and direction?
To convert from polar to cartesian, multiply the length by the sin of the angle for X and by the cos (cosine) of the angle for Y. Then add this coordinate to your last location to find your new location. This would let you take the Outrun table and make a X,Y plotted graph.
Now you want to draw a new path, and convert it to Outrun data (cartesian to polar). For each segment, you need the relative X,Y for the segment (called a vector), so get it by subtracting the X,Y of the end point from the X,Y of the start point. Then use pythagorean to find the length = sqrt(x*x+y*y) and use atan2(Y/X) to find the angle.
sin/cos/atan2 use radians, but the encoded angle might not be degrees or radian. Games often used "binary radians" or brads. See http://en.wikipedia.org/wiki/Binary_scaling#Binary_angles
Hmm... my initial thought was also that it was some kind of vector based system. Although I suspect it's more complex than that unfortunately.
You'll need to look at the excel sheet, and work your way across the calculations performed to take things from raw data to an x-coordination.
Some stuff is familiar, for example at the start of the calculation some of the values are summed before their length is found with a typical sqrt. But not exactly sure what the maths is doing after that.
It's just a 12-bit fixed-point sin/cos LUT.
It's not a sin/cos LUT as such. It's a series of co-ordinates that represent the level data. (they would map to a sin/cos table though, hence the circle visualization).
You would generate those points in the level editor using sin and cos and the known radius/hypotenuse.
This flash demo provides a good example.
Obviously we'd want to represent the points as a continuous track/path in the level editor though....
Of course it is a sin/cos LUT. The game is using triginometry for curved tracks --which is no surprise at all.
A sin/cos LUT would indicate a table containing a series of values, that you index with an angle.
That's how I used LUTs in game dev at least.
There is no LUT here, as the values I'm referring to are a series of Cartesian coordinates.
Either way, I suspect we're sort of trying to say the same thing :)
The Cartesian coordinates of a circle are x=cos and y=sin.
It is how we did the did stuff on hardware without FPU fancies or a div instruction to compute sine and cosine.
The number of entries is the actually the precision of the angle --no body says it needs to be 2 PI, 360 or 400. It can be anything as you fit in your code.
And the circle length of 4096 is again not a circle length of 4096. It's fixed point arithmetic with 12 digits precision. 4096 is 1, really.
Deltat - I totally get what you're saying and suggesting, including the fixed point stuff and the precision.
But have you scrolled down through the first two columns in the XLS?
If you plot them in the order they are (summ the previous entry), they represent the path of that the road takes.
Example Image
I'm not sure if my circle render is causing confusion. This is only the case if you plot all the points (ignoring their order) on a scatter graph.
Oh, I see. Sorry about the confusion. I just downloaded the Excel file.
I believe it can be expressed as a parametric sin/cos LUT then, of the form:
x = R cos(θ(t))
y = R sin(θ(t))
And θ(t) appears to be a piecewise continuous function, with pieces being constant and linear in t.
Since when you do the parametric plot, it makes at least one rotation, it would mean that θ(t) passes 0 point at least twice.
Using different functions for θ(t) would lead to different tracks. Maybe this is how they made these tracks?
Will let you know how I get on anyway with the level editor :)
Just teaching myself QT as a starting point.
Thanks!
I think what I said above is equivalent to this:
The track is made of two kinds of "pieces" 1) straight piece of road (constant case) 2) a curve that was cut as a piece from a circle (linear case), the arc length can be anything.
And indeed, this is how some toy car tracks are built.
Yes, in the second case a curve that was cut from a piece of circle where any number of straights can be inserted within that curve - hence adjusting the overall curve.
The interesting challenge will be thinking of the best way to design these tracks in an editor.
Ideally you want to easily lay out the track, whilst dealing with things like the fact that the track can actually overlap itself (as you saw in the coconut beach screenshot).
Maybe the track editor allows you to place a bunch of pre-cut track pieces? That would be faster, but lacks granularity.
Maybe the track editor allows you to configure your own track pieces and then place them as brushes.
Maybe we don't worry about the above and somehow allow the user to plot the track path.
Each track is a hard-coded length. (Positions 0 to 0x79C). So there's the table you saw in the Excel. Then there are a bunch of other tables which say things like:
At position 0x215, adjust the width of the track to "x" at a speed of "y".
Another table will say at position 0x156 apply sprite pattern 0x7F with render pattern x, y times.
And there's another table for the height.
Post a Comment